CySA+ Notes and Exam Tips
This article is comprised of the topics I felt were most relevant when studying for CySA+. This is not a comprehensive list. Make sure you really know the Incident Response Life Cycle, Threat Intelligence, Reading Logs, and IOC’s and the remediations. The exam will ask you “What is the BEST solution” or “What is the NEXT step”, pay attention to those keywords. What may be BEST is not necessarily what is the NEXT step in incident response. When in doubt, go by the Incident Response Life Cycle, it’s a lifesaver. Especially the Containment step. This exam involves a lot of critical thinking so KNOW YOUR SH*T! You will NOT get by just memorizing definitions. I personally studied 6–8 hours per weekday, doing about two practice tests per day the week of the exam. I studied for 3 weeks then I sat for the exam. I highly recommend the Sybex book. Had the best explanations in my opinion.
Anyways, I hope that little explanation helped. On to the notes:
Status Codes
Informational (100–199): These status codes indicate that the server has received the request and is processing it.
Success (200–299): These status codes indicate that the request was successful and the server was able to deliver the requested content.
Redirection (300–399): These status codes indicate that the client needs to take additional action to complete the request, such as following a redirect.
Client Error (400–499): These status codes indicate that the request was invalid or could not be completed due to an error on the client side.
Server Error (500–599): These status codes indicate that the server encountered an error while processing the request.
Network IOCs:
Unusual traffic patterns or spikes in network activity
Unauthorized devices or connections on the network
DNS or IP address anomalies, such as traffic to known malicious IP addresses or domains
Unexpected protocol usage or protocol anomalies
Suspicious file transfers or data exfiltration
Unauthorized access attempts or login failures
Host IOCs:
Suspicious files or processes running on a host
Unusual system or application behavior, such as crashes or freezes
Unauthorized software installations or changes to system files
System logs showing unusual activity or errors
Changes to user account privileges or permissions
Evidence of data theft or destruction
Application IOCs:
Unusual or unauthorized user activity, such as unusual login patterns or unusual data access
Unauthorized changes to application configuration or settings
Known vulnerabilities or exploits associated with the application
Suspicious application traffic, such as traffic to known malicious domains or IP addresses
Presence of malicious or unauthorized files within the application
Evidence of unauthorized access or data exfiltration within the application.
Nmap Commands
Port scanning methods supported by Nmap:
“TCP SYN (Stealth) Scan (-sS)” (-sS)
This is far and away the most popular scan type because it the fastest way to scan ports of the most popular protocol (TCP). It is stealthier than connect scan, and it works against all functional TCP stacks (unlike some special-purpose scans such as FIN scan).
“TCP Connect Scan (-sT)” (-sT)
Connect scan uses the system call of the same name to scan machines, rather than relying on raw packets as most of the other methods do. It is usually used by unprivileged Unix users and against IPv6 targets because SYN scan doesn’t work in those cases.
“UDP Scan (-sU)” (-sU)
Don’t forget UDP ports — they offer plenty of security holes too.
“TCP FIN, NULL, and Xmas Scans (-sF, -sN, -sX)” (-sF, -sX, -sN)
These special purpose scan types are adept at sneaking past firewalls to explore the systems behind them. Unfortunately they rely on target behavior that some systems (particularly Windows variants) don’t exhibit.
“TCP ACK Scan (-sA)” (-sA)
ACK scan is commonly used to map out firewall rulesets. In particular, it helps understand whether firewall rules are stateful or not. The downside is that it cannot distinguish open from closed ports.
“TCP Window Scan (-sW)” (-sW)
Window scan is like ACK scan, except that it is able to detect open versus closed ports against certain machines.
“TCP Maimon Scan (-sM)” (-sM)
This obscure firewall-evading scan type is similar to a FIN scan, but includes the ACK flag as well. This allows it to get by more packet filtering firewalls, with the downside that it works against even fewer systems than FIN scan does.
“TCP Idle Scan (-sI)” (-sI <zombie host>)
Idle scan is the stealthiest scan type of all, and can sometimes exploit trusted IP address relationships. Unfortunately, it is also slow and complex.
“IP Protocol Scan (-sO)” (-sO)
Protocol scan determines which IP protocols (TCP, ICMP, IGMP, etc.) are supported by the target machine. This isn’t technically a port scan, since it cycles through IP protocol numbers rather than TCP or UDP port numbers. Yet it still uses the -p option to select scanned protocol numbers, reports its results with the normal port table format, and even uses the same underlying scan engine as the true port scanning methods. So it is close enough to a port scan that it belongs here.
“TCP FTP Bounce Scan (-b)” (-b <FTP bounce proxy>)
This deprecated scan type tricks FTP servers into performing port scans by proxy. Most FTP servers are now patched to prevent this, but it is a good way to sneak through restrictive firewalls when it works.
More Nmap…..
If a port is closed, which flag should the server send back to indicate this? RST
Many firewalls are configured to simply drop incoming packets. Nmap sends a TCP SYN request, and receives nothing back. This indicates that the port is being protected by a firewall and thus the port is considered to be filtered.
SYN scans are the default scans used by Nmap if run with sudo permissions. If run without sudo permissions, Nmap defaults to the TCP Connect scan we saw in the previous task.
If a port is closed then the server responds with a RST TCP packet. If the port is filtered by a firewall then the TCP SYN packet is either dropped, or spoofed with a TCP reset.
The -sn switch tells Nmap not to scan any ports — forcing it to rely primarily on ICMP echo packets (or ARP requests on a local network, if run with sudo or directly as the root user) to identify targets. In addition to the ICMP echo requests, the -sn switch will also cause nmap to send a TCP SYN packet to port 443 of the target, as well as a TCP ACK (or TCP SYN if not run as root) packet to port 80 of the target.
We have already seen some techniques for bypassing firewalls (think stealth scans, along with NULL, FIN and Xmas scans); however, there is another very common firewall configuration which it’s imperative we know how to bypass. Nmap provides an option for this: -Pn, which tells Nmap to not bother pinging the host before scanning it. This means that Nmap will always treat the target host(s) as being alive, effectively bypassing the ICMP block; however, it comes at the price of potentially taking a very long time to complete the scan (if the host really is dead then Nmap will still be checking and double checking every specified port)
More Nmap Firewall Evasion Flags:
-f:- Used to fragment the packets (i.e. split them into smaller pieces) making it less likely that the packets will be detected by a firewall or IDS.
An alternative to -f, but providing more control over the size of the packets: — mtu <number>, accepts a maximum transmission unit size to use for the packets sent. This must be a multiple of 8.
— scan-delay <time>ms:- used to add a delay between packets sent. This is very useful if the network is unstable, but also for evading any time-based firewall/IDS triggers which may be in place.
— badsum:- this is used to generate in invalid checksum for packets. Any real TCP/IP stack would drop this packet, however, firewalls may potentially respond automatically, without bothering to check the checksum of the packet. As such, this switch can be used to determine the presence of a firewall/IDS.
Hping Commands
Basic TCP connection test:
hping3 -S <target IP>
This command sends a SYN packet to the target IP to test if a TCP connection can be established.
Ping sweep:
hping3 -1 <target IP range>
This command performs a ping sweep of the specified IP range to identify active hosts.
Traceroute:
hping3 — traceroute <target IP>
This command traces the path of packets from the source to the target IP, showing the number of hops and the time it takes to reach each hop.
SYN flood attack:
hping3 -S -p <port> — flood <target IP>
This command sends a flood of SYN packets to the target IP to overload and potentially crash the target server.
UDP flood attack:
hping3 -2 -p <port> — flood <target IP>
This command sends a flood of UDP packets to the target IP to overload and potentially crash the target server.
OS fingerprinting:
hping3 -F -A -V <target IP>
This command uses various techniques to identify the operating system of the target IP, including sending a FIN packet, an ACK packet, and a TCP timestamp packet.
Tcpdump Commands
Basic packet capture:
tcpdump -i <interface> -n
This command captures network traffic on the specified interface and displays the output in a human-readable format with IP addresses instead of hostnames.
Filter by protocol:
tcpdump -i <interface> -n <protocol>
This command captures network traffic on the specified interface for a specific protocol (such as TCP, UDP, ICMP, etc.) and displays the output in a human-readable format.
Filter by source or destination IP address:
tcpdump -i <interface> -n host <IP address>
This command captures network traffic on the specified interface for packets with a specific source or destination IP address and displays the output in a human-readable format.
Filter by port:
tcpdump -i <interface> -n port <port number>
This command captures network traffic on the specified interface for packets with a specific port number and displays the output in a human-readable format.
Save output to a file:
tcpdump -i <interface> -n -w <filename>
This command captures network traffic on the specified interface and saves the output to a file with the specified filename for later analysis.
Read output from a file:
tcpdump -r <filename>
This command reads the output file generated by Tcpdump and displays the output in a human-readable format for analysis.
Netstat Commands
Display all active network connections:
netstat -a
This command displays all active network connections on the computer, including TCP and UDP connections, listening ports, and established connections.
Display active TCP connections:
netstat -at
This command displays all active TCP connections on the computer, including listening ports, established connections, and the IP addresses and port numbers of both the local and remote hosts.
Display active UDP connections:
netstat -au
This command displays all active UDP connections on the computer, including listening ports and the IP addresses and port numbers of both the local and remote hosts.
Display network interface statistics:
netstat -i
This command displays statistics for all network interfaces on the computer, including the number of packets sent and received, errors, collisions, and more.
Display active network connections with process information:
netstat -ap
This command displays all active network connections on the computer, along with the process ID (PID) and name of the associated process.
Display network routing table:
netstat -r
This command displays the network routing table on the computer, including the routing destination, gateway, and interface, as well as the route’s metric, flags, and more.
Dig Command
Basic DNS query:
dig <domain name>
This command performs a basic DNS query for the specified domain name and displays the results, including the IP address of the associated server and any relevant DNS records.
Reverse DNS lookup:
dig -x <IP address>
This command performs a reverse DNS lookup for the specified IP address and displays the associated domain name and any relevant DNS records.
Specify DNS server:
dig <domain name> @<DNS server IP>
This command performs a DNS query for the specified domain name using the specified DNS server instead of the default DNS server.
Query specific DNS record type:
dig <domain name> <record type>
This command performs a DNS query for the specified domain name and displays the specified type of DNS record, such as A, MX, TXT, or NS.
Enable recursion:
dig <domain name> +recurse
This command performs a recursive DNS query for the specified domain name, which means that if the DNS server does not have the answer, it will query other DNS servers until it finds the answer.
Display additional DNS information:
dig <domain name> +all
This command displays additional DNS information for the specified domain name, including the DNS server used, the query time, and any relevant DNS flags.
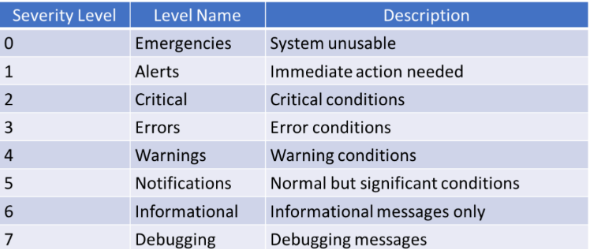
Syslog Log Levels
Incident Response Life Cycle
Preparation; Detection and Analysis; Containment, Eradication, and Recovery; and Post-Event Activity.
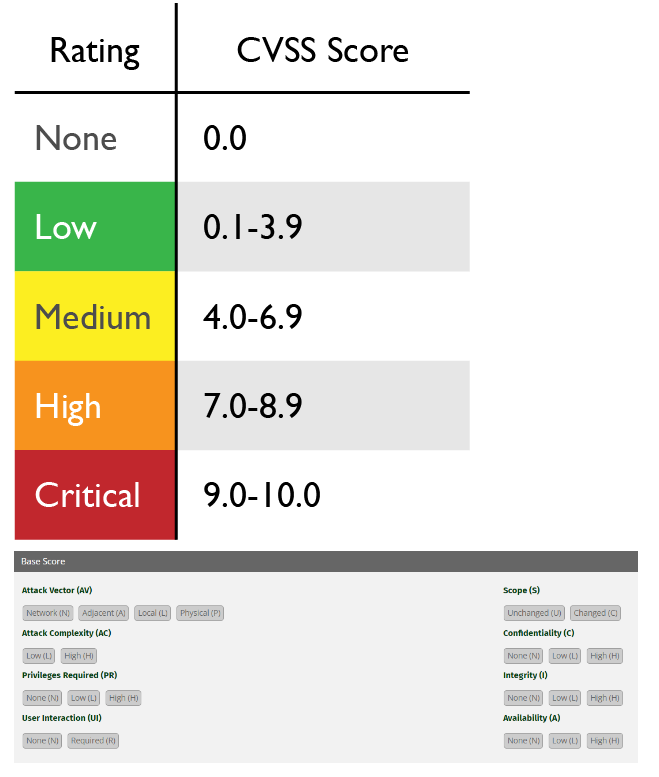
CVSS